 Waypoint Based Map Maker
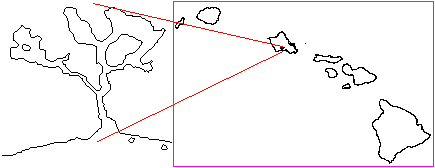 Waypoint Based Map Maker
This program draws maps based on lists of latitude/longitude coordinates. This program can draw a map of anything that can be represented by a list of coordinates, including roads, railroads, rivers, streams, borders of lakes, property boundaries, power lines, trails, and many other things. Different colors can be used to represent different things.
My program is capable of drawing maps of any location in the world if given the proper coordinates. All one needs to do is gather the coordinates and put them into a file in the proper format, then load the file into the program. You can then center the map to the coordinates you added and zoom in until you can see the detail you are looking for.
In addition to the outline map of Hawaii above, here is a sample of what this program can do. This is a map of northern New Jersey, showing some of the major interstate highways as well as various roads. Roads include portions of the Garden State Parkway, Interstates 78 and 287, routes 202 and 206 from Bridgewater towards Pennsylvania and Princeton/Trenton, and Rt. 22 east of Bridgewater. A few rail lines are also shown in black, particularly the Northeast Corridor (Amtrak, NJTransit passenger rail line), and the NJTransit Gladstone Branch from the Midtown Direct connection with the Northeast Corridor to the Millington station. The map on the right shows the zooming capability. It shows the roads in a subdivision in Northern New Jersey. The map is about 1 mile across.
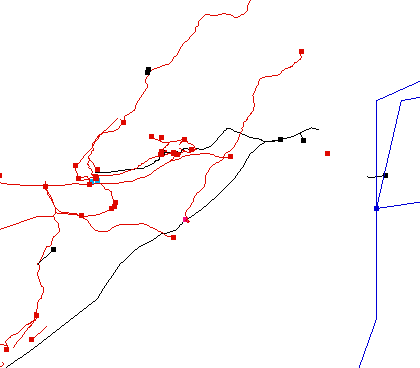
As you can see, the coastline is a little too far to the east. The black line that crosses the blue coastline is a subway line in Brooklyn. The coastline is off because the coordinates used are part of a relatively low resolution world map of major coastlines.
Other areas I have partially mapped out include Albany/Schenectady, the eastern Adirondack region of New York State, portions of the north side of Philadelphia, Dayton, Tennessee; Atlanta, Georgia; Birmingham, Alabama; Morelia, Mexico; and portions of Chicago, Los Angeles, Jacksonville, Florida, and various roads and rail lines in between. I also have a file of coordinates that provides an outline map of the major coastlines of the world.
Expanding the map
I am interested in expanding this map to include many things it does not yet have. There are some gaps in highways and rail lines, plus many highways and rail lines that I don't have. If you can extract a track log from your GPS, you can help. Just have your gps on while you drive or ride the train. Then send me the track log, and I'll add it to my map if I don't already have the route. You can send these files to me at Bill222E@ensingers.com.
Editing capabilities
NOTE: Some projections, editing capabilities, and link w/ GPS are not yet available or fully functional in the currently distributed version.
This program has a set of editing tools for linking points on the map to create new routes or even moving a point to a new location. Points on a route can also be given labels. Routes can then be exported as Track Logs or Waypoint lists compatible with MacGPS Pro and the scaled down free version of MacGPS Pro: MacGPS.
The above capabilities can and have been combined to make this program quite powerful for many things, such as creating a list of waypoints for export into a GPS unit (such as the location of a series of Amtrak stations), making a newspaper delivery map complete with the locations of those who get the paper, creating a map to provide directions to a location, plotting locations of Geocaches relative to local roads, other geocaches, or other geological or physical features, creating a map of a plot of land, plotting fishing locations, creating a map of roads in a subdivision, showing the progress of objects moving from place to place such as Geocaching travel bugs, and many other possibilities.
I am also available for hire to use this program on your behalf to meet your needs. This is especially useful if your computer systems are not capable of running this program. There's no charge if I can't do what you are looking for, so there's no risk in contacting me. Just click here and send me a message!
Link with GPS
This program will link with a gps unit via MacGPS Pro with the "Collect Current Readings" option in MacGPS or MacGPS Pro. If anyone can help me develop a direct link to a variety of GPS units, please contact me.
Various Projections
This program will display the map in a variety of projections, but not all features work correctly with all projections (especially editing and scrolling). Only the flat map (No Projection described below) works reliably for all features, but the other projections will cooperate with many or most of the features.
Program and System information
The program plots coordinates in the position format hddd.ddddd and map datum format WGS 84, and plot relatively correctly on a map of the major world coastlines drawn by a set of coordinates I got back in 1996. All coordinates I have gathered so far fit these formats. It can also open track log and waypoint files from MacGPS and MacGPS Pro.
The program runs native on the Power Macintosh up through System 9.x and in OS X Classic environment, but not natively on OS X.
I am still working on this program. There are several significant improvements I would like to make. They are:
Be able to link directly to a GPS unit to show current position, scrolling the map as the current position changes
Make the other projections more reliable
Allow for development of plug-ins to support additional projections
Provide more functions for showing elevations, showing distances, calculating best routes, etc.
I believe this program has the potential to fill the void of really good mapping software for the Macintosh, though admittedly much further development is required. Still, this program goes a long way to providing a fairly easy to use piece of software yet is still reasonably powerful for what it does.
If you know how to handle these things, please contact me at Bill222E@ensingers.com.
This program has been changed significantly from when it was originally written. As a result, only the old version will allow viewing data points from a data file that was organized differently (this file's data points were very low-resolution.)
To obtain the program, please contact me at Bill222E@ensingers.com and indicate whether you would like the new or the old version. The new version is Shareware: $10. The old version is free.
Projections
The following is a description of each of the projections available in the original program. I've included pictures for 3 of them. To see the others, You'll need to run the old version of the program yourself.
No Transformation:
![]()
This is just a straight plotting of the latitude and longitude points.
This projection works as advertised in both old and new versions.

Mercator:

The Mercator projection was derived by Gerhard Mercator. This
projection is mainly designed for navigational purposes.
Interestingly, this projection did not appear in Mercator's own atlas.

In my program, this map seems to be drawn a little too stretched to
the north and south.

Spherical polar Stereographic:

I did not find any historical background on this projection.

Aitoff Projection:

This projection was derived by David Aitoff, in 1889. It inspired
Hammer to develop his well known equal area projection, in 1892.

I don't believe my drawing program draws this map correctly.
Pseudoconical:
This projection was derived by Bonne (1727-1795). This projection is
also known as Bonne's projection, but the concept for the projection
comes from Ptolemaeus.

I don't believe my drawing program draws this map correctly, though I
don't believe it is far off what it should be.
Humorous:
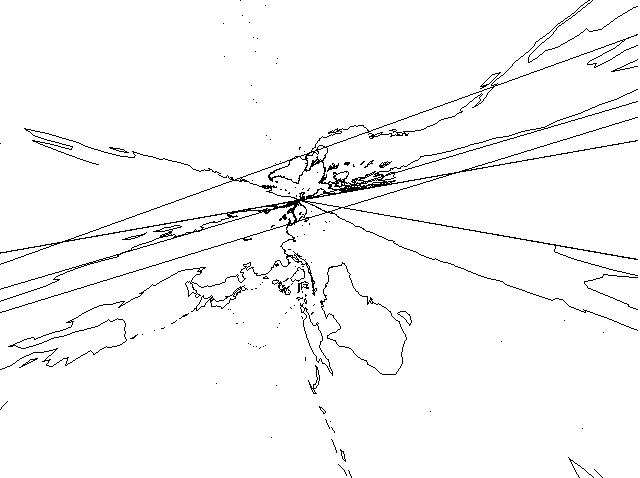
This projection is really another projection for which the formulas went
amuck. Note that Alaska is quite large and points to the upper right
while the entire east coast of North and South America looks like it is
being pulled together into a black hole. Antarctica is stretched through
the middle, while Europe and Asia extends from a point to the bottom
right. If I were to guess, I'd say this projection attempts to put the
north and south poles at the same point. If anyone can explain what is
going on here, please let me know! Thanks. My e-mail is: Bill222E@ensingers.com.
If this projection ever becomes popular, I claim copyright for it now.
A little history
My Senior year in college at Taylor University, I had to make a program that would draw a map given a list of coordinates. This project was done in January, 1996 and dated January 13, 1996.
On March 27, 2003, I realized this program could plot coordinates for anything, including coordinates gathered by my GPS unit. Using the line drawing capability already built into the program, I realized I could connect the dots to show routes for roads, railroads, property lines, lake edges, or just about anything else. At this point I realized that the capabilities of my program were very limited, so I spent the next few months adding things like being able to zoom with a keyboard command, scroll with the mouse, colored routes, edit points in a variety of ways, and save the results. I also fixed many problems especially with printing and when zooming in to high resolutions.
INFORMATION ABOUT THE OLD VERSION
User Instructions:
To view a map, choose "Open" from the file menu and select a coordinates
file in the standard Macintosh way. The files are in the "Map Files"
directory. The files are called, "world.bet" and "world.map." Then
choose your projection, resolution size, and amount of rotation from
the dialog box. When you click "Draw the Map!" the map will be drawn
in a new window, with the projection name as the title. You can change
the map and projection used by selecting "Edit Map parameters" from the
bottom of the "Edit" menu. That will give you the same dialog box you
had after you initially opened the file. You may print any of the
projections you can display in a window by simply selecting "Print"
from the "File" menu.

Latitude/Longitude boxes only deal with whole numbers
To scroll the map east, Decrease the number in the Longitude box
To scroll the map west, Increase the number in the Longitude box

To scroll the map north, increase the number in the Latitude box
To scroll the map south, decrease the number in the Latitude box

To view the United States up close, enter the following in the "Edit
Map Parameters..." dialog box:
No Projection
Latitude: 39

Longitude: -55

Zoom factor: 12

To view the projection "Humorous", try setting the zoom factor to
20.

Bugs in the program (These have all been fixed in the updated version):
Don't use a print command if you have changed printers with the chooser
while the program has been running
When processing world.bet, if it runs into text, it doesn't process the
info correctly
If it runs into an "]" or other non-text character, it hangs. If this
happens, hold down control-apple-escape, then click "force quit."
Doesn't close files until the program quits, thus you can't delete a file
 even after you close the corresponding map window.
Try using file "Amtrak.map" and entering:
 Latitude: 55, Longitude: -60, Zoom factor: 30 A line is drawn across the
 top of the map that shouldn't be there.
 Latitude: 48, Longitude: -104, and Zoom factor: 183 through 217. Random
 lines are drawn that shouldn't be there
At high zoom factors, (above 500 or so) the drawing gets erratic.

Technical details:
The program did not use any data structures to store the numbers
provided in the map file. Instead, I plotted each point as I read it
in from the file. I used a "struct" structure to store information about
each window containing a map. The Macintosh uses various data structures
to hold information about windows, menus, and dialog boxes, all of which
are editable in a program called ResEdit. My program makes use of these
structures. I do not know how these data structures are structured.

This program lets you view and print a map of the world in several
different projections and sizes. The two files that were given to us
are included, and any other files may be used, as long as the
coordinates follow the formats of one of the two included files. The
program follows the standard Macintosh interface for as much interface
as it needs, except in a couple of areas. When the user chooses a file
for displaying, the program opens the file, and determines which of the
two files it is. Since each file is formatted differently, the
function that draws the map is split in strategic spots so that some
code can be used for both files.
The program in general is highly modularized. This means that it is
divided up into functions that respond to user interaction with the
interface, as well as for the displaying of the map.
When the screen needs to be redrawn because something besides a menu
covers part of the map window, the map needs to be redrawn. Instead of
going through the process of reading the data points in from disk and
redisplaying them in my window, I have set up some off screen windows
to which I store a bitmap of what I display in the map window. When the
update event occurs, (part of the map window was hidden and has now
become visible again) I call a function called CopyBits, which copies,
all at once, the entire bitmap back to the map window. This is nice
because it happens extremely fast. The program is limited in that it
can only read from two types of file formats. The program is also limited in that it can only display the maps in black and white. Since the window is
not resizable and there are no scroll bars, another limitation is that
to see portions of the map outside what is displayed requires changing the center of projection manually.


Program Design/Structure:
My program design was taken from various pieces of example code from
the internet, various books on programming the Mac, and other sources.
Virtually all of the interface code and interface interaction code came
from these sources, most of which I modified to some degree to fit my
needs. The equations for the map plotting code was taken from The
World in Perspective, which is listed in the Bibliography.

For the purpose of my Senior Project, I had to put together a brief
history of map making:
Long before it was widely accepted that the earth is round, the making
of maps was common. The earliest drawing that can be considered a map
dates back to Babylonian times, around 2300 B.C. These drawings were
made on clay tablets.
In those days, and even today, while map making technology has changed
drastically, the purpose of a map has remained much the same. Maps are
used to show political boundaries, routes between cities, hazards,
locations of enemies, water sources, land marks, and numerous other
features.
It is not certain exactly who made the first hypothesis that the earth
is round. Pythagoras, in the 6th century B.C. did some work in this
area. It was either him or Parmenides, in the 5th century B.C.,
building on the work of Pythagoras, who came up with the idea, along
with several supporting arguments.
Ptolemy also believed the earth was round, but his maps showed that
Europe and Asia extended around more of the globe than they actually
do. This hypothesis perpetuated all the way up till the days of
Columbus. When Columbus made his voyage, he was seeking a shorter
route to India, not another continent in the way!
In the 18th century, the technology for making maps improved
dramatically. Most notably, the invention of an accurate time piece
that didn't require the sun helped cartographers measure latitude and
longitude. In the 20th century, the invention of the airplane, and
both world wars pushed map making even more. The maps were critical
for making strategic war plans, and the plane helped by taking pictures
of the earth from high in the sky.
A project to map every part of the earth was begun late in the 1800's,
and now, a hundred years later, the project is still not finished, but
is nearing completion. Even today, with our satellites that can read
car license plates from their orbits several thousand miles up, there
are still areas of the earth that have not been mapped.

Bibliography:

Info for the essay on the history of mapping was taken from:
Encyclopedia Britannica Macropaedia, "Mapping and Surveying", (J. W.
Wr. / Ed), Vol. 23, pg. 473-494.

Info on the descriptions of the projections was taken from:
The world in Perspective, A Directory of World Map Projections by Frank
Canters and Hugo Decleir. Copyright 1989 John Wiley & Sons Ltd.,
Baffins Lane, Chichester West Sussex, PO19 IUD, England.
Source Code Listing: If you would like the source code for the original program, please e-mail me at: Bill222E@ensingers.com. The resource file is also available (for Macintosh).
The file of coordinates can be obtained by e-mailing me at: Bill222E@ensingers.com. Request one or both files:
world.mapContains coordinates for the major continents and large islands. Not much detail. This file only works with the original version of this program.
or
world.betContains many more coordinates for the main continents as well as many more islands than world.map. This file (with numerous routes added) is included in the updated version.